Dashboard
Overview
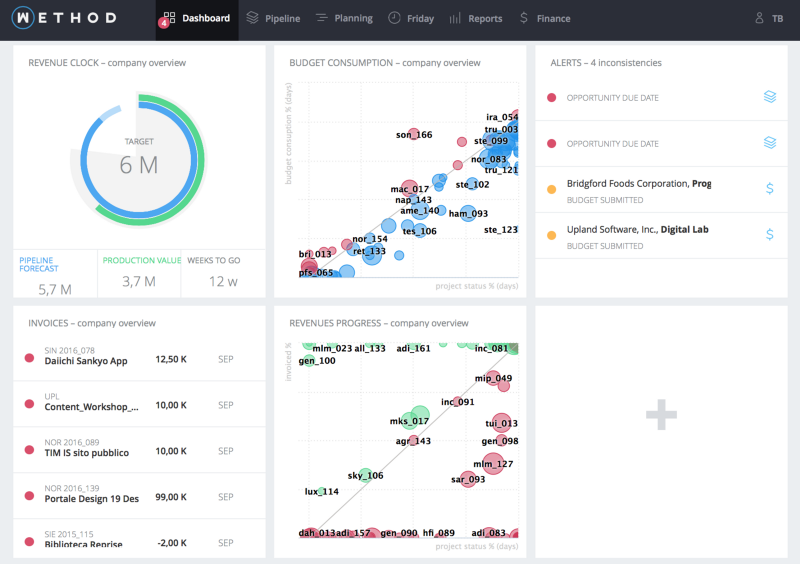
The Dashboard is basically a set of widgets, any one of which can be added or removed and customized by the user.
Widgets
Adding a new widget to your dashboard is very easy: just click on the “+” sign and pick one from the list of the available widgets.
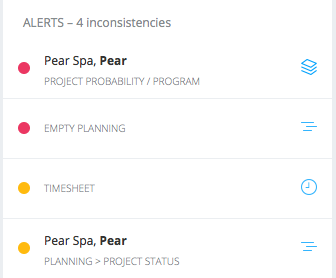
Alerts
This widget shows all the inconsistencies regarding the user. Each alert has a priority (indicated by its color):
- Red alerts have a high priority and must be solved as soon as possible;
- Yellow alerts have a low priority and can be seen as a advice then anything.
Hovering the cursor over an alert will display a description of the problem.
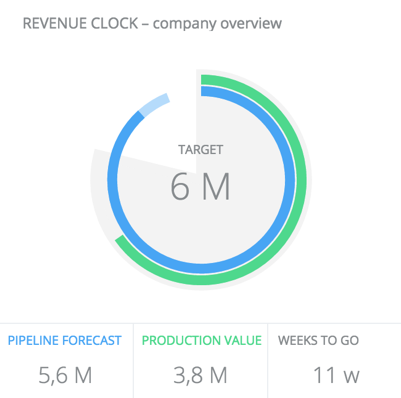
Revenue Clock
This widget lets you quickly compare the revenue pipeline (blue) with the production value (green). The part in opacity represents the total value of opportunities (with less than 90% of probability to be won), meanwhile the full colored represents all won project’s total value (with 90% of probability or more).
When you create the widget, you must set the production target you want to hit by the end of the year.
When the filter is set to company overview the target will automatically be set as the profit & loss budget target for the current year.
When the filter is set to client the target will automatically be set as the revenues target for the current year.
The grey area shows the percentage of the year gone or, by another point of view, how much time you still have to hit your annual target.
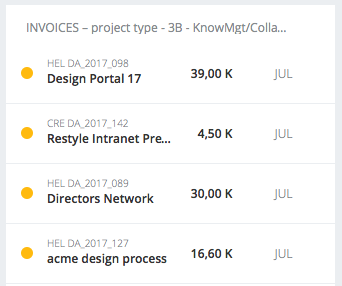
Invoices
This widget shows all the invoices that must be sent. The invoice list is based on the pipeline’s invoice plan and each invoice has a priority (indicated by its color):
- Red invoices have an high priority because they had to be sent in a past date;
- Yellow invoices have a low priority because they have to be send in a future date.
Hovering on an invoice will shows you the buttons to:
- Go to the project’s budget;
- Create the invoice.
By clicking on an invoice you can select it, plus others and create multiple invoice at once. The created invoices will be automatically filled with the right project’s name, client, job order, value and due date. You still can edit your invoices before sending them.
Budget Consumption
This widget is a resume of the Budget Consumption report .
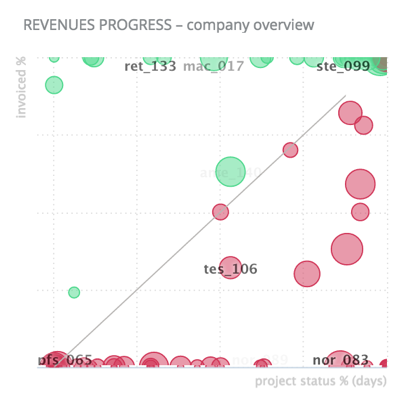
Revenue Progress
This widget is a resume of the Revenue Progress report .
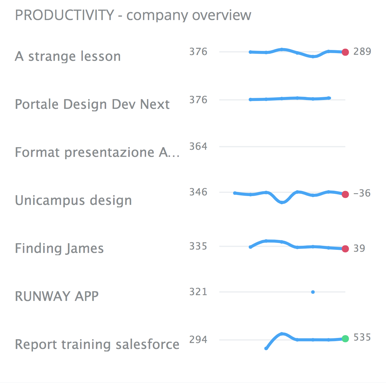
Roadrunner Index
This widget shows the Roadrunner Index for each of your projects.
Clicking on a project will take you to its detailed report.