Revenues
Overview
An aggregated view for the revenues report
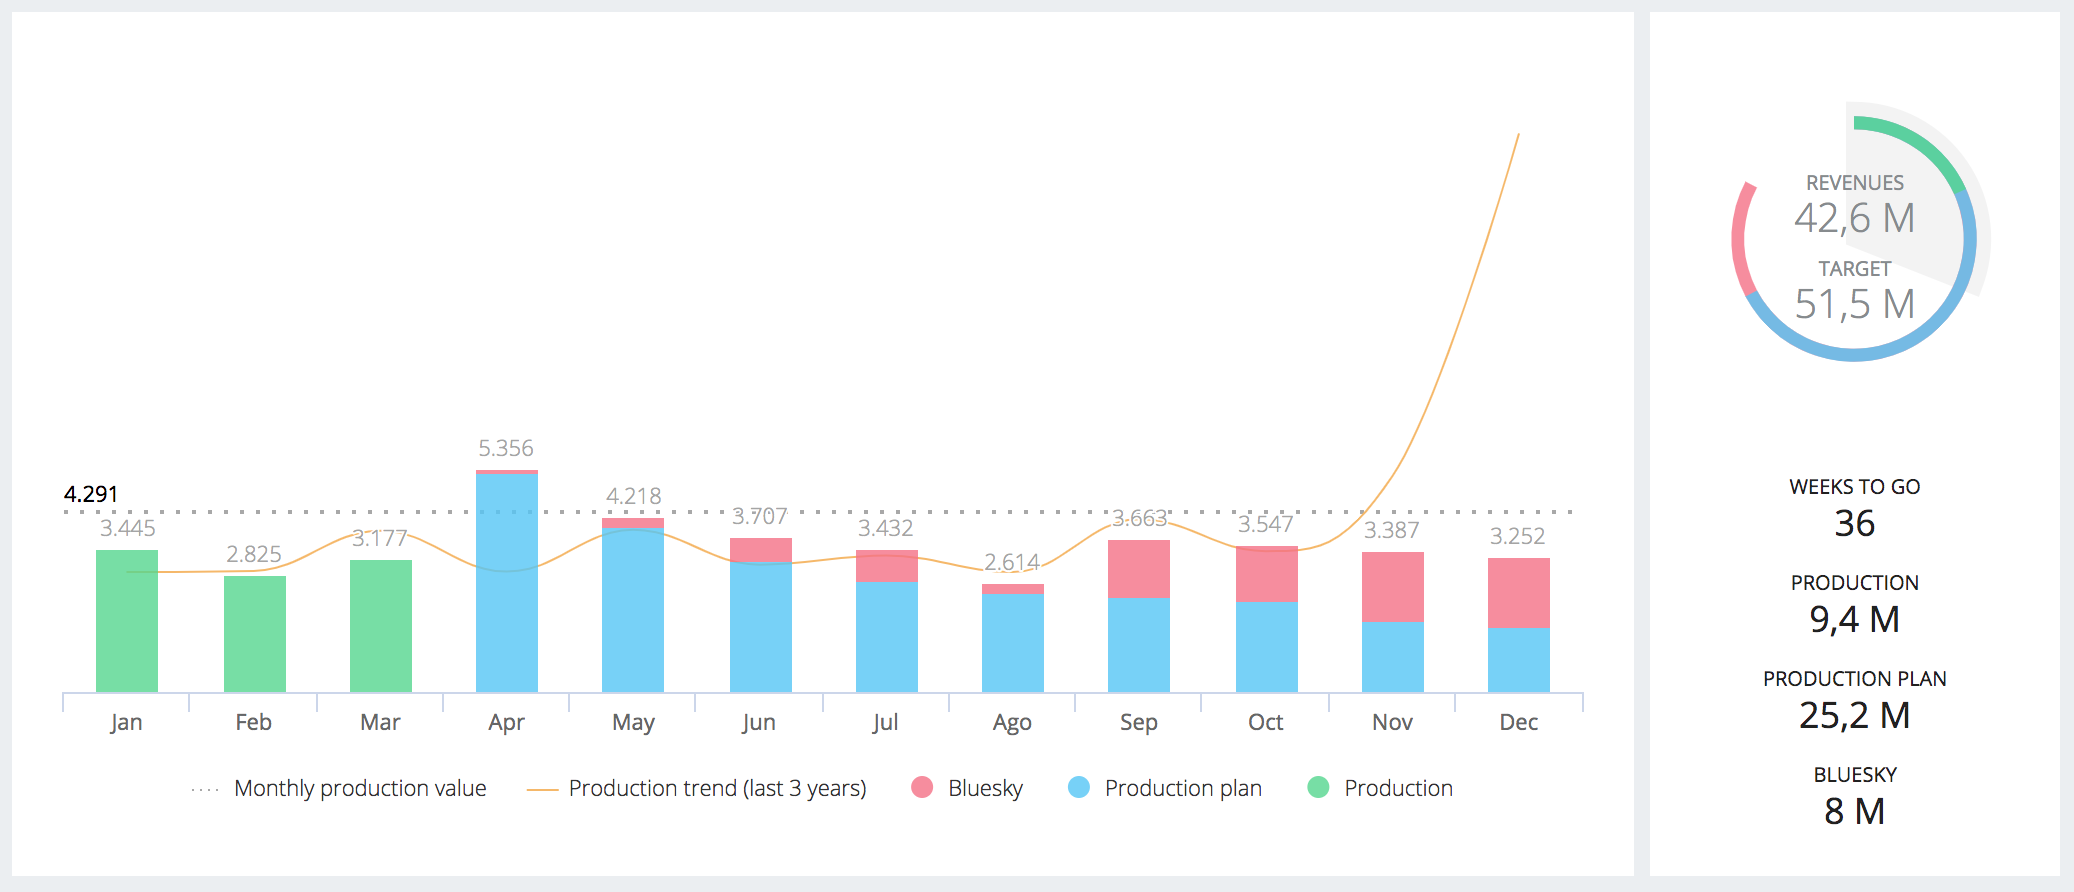
Revenues by month
Here you have the yearly revenues of your group, distributed on a monthly basis. As you can see in the legend, there are various notable things in the chart:
- Production based on companies’ project status
- Production plan based on companies’ production plan
- Bluesky based on companies’ bluesky
- Monthly production value obtained by dividing the target (which you can edit from the company’s profit & loss and displayed inside the clock chart on the right) for 12 (the number of months per year)
- Production trend based on the production of the last three years
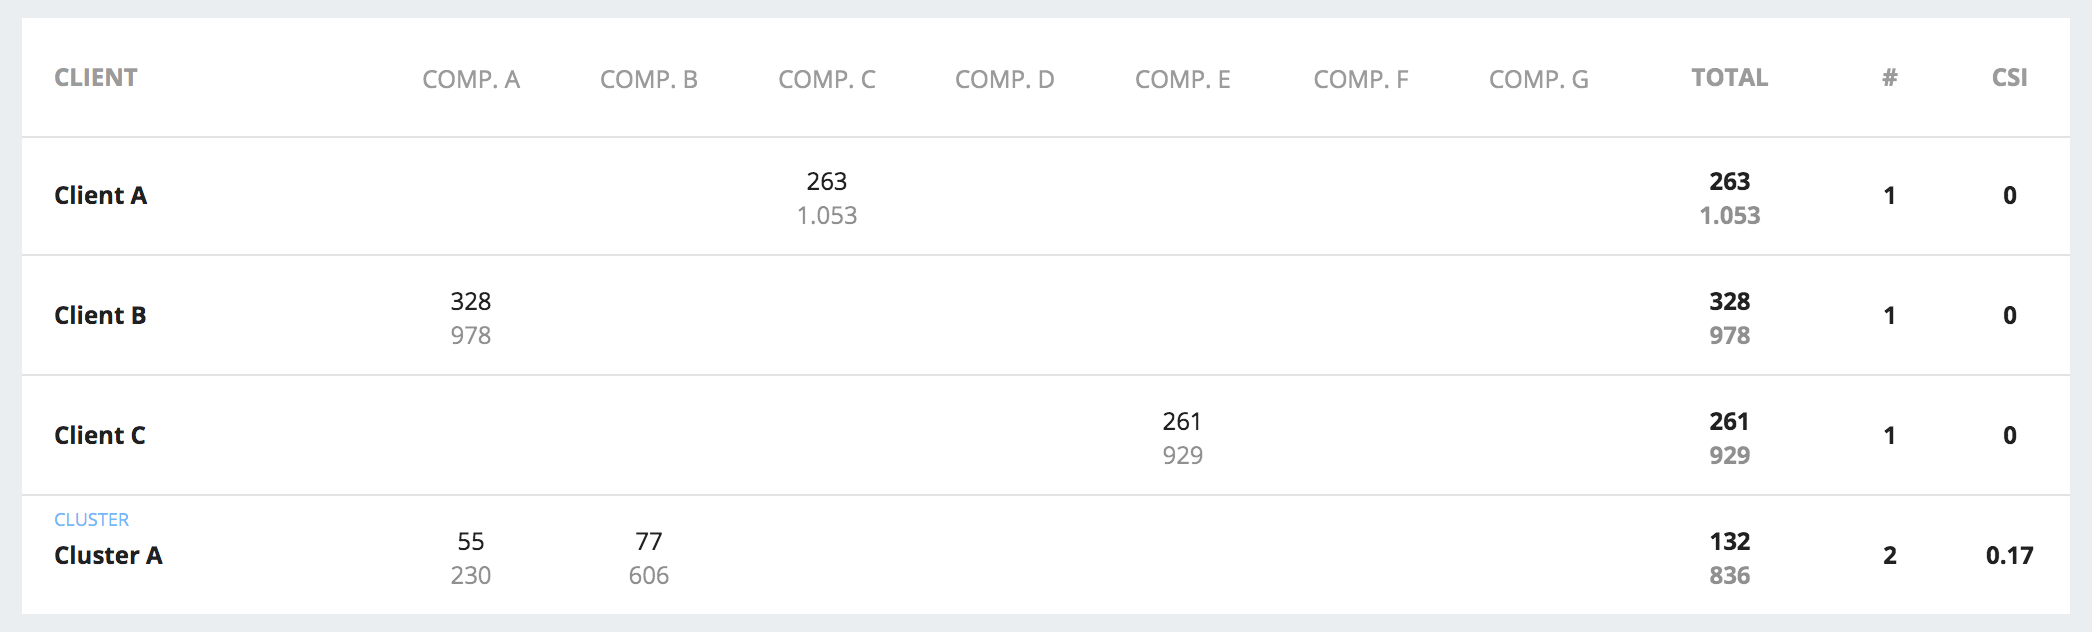
Revenues by client
A table where you can appreciate how much production has been generated from each company of the group an towards each of their clients. The actual production is always compared to the planned one, in the client’s column are listed your clusters too.
The C.S.I (cross-selling index) column shows how much each client/cluster is off from the ideal distribution among the companies of the group. It goes from 0 to 1 where 0 means all the revenues of a client/cluster is produced by only one company a.k.a “the worst case scenario”; 1 means that the revenues of the client/cluster is produced equally by each company in the group a.k.a “the best case scenario”.
The Count (#) column shows how many companies are working for each client/cluster.
Note
Data in this section use a daily cache to keep things fast. If you need something more updated please use the “Refresh data” button.